AUD/JPY Price Analysis: Cross enters in consolidation phase, downturn likely momentary
- Daily chart indicators suggest correction phase sets in; RSI drops signifying easing of overbought conditions.
- Hourly chart indicators remain in negative territory, signaling downside correction in the near term.
- Bulls show signs of exhaustion, unable to retest 105.00 highs.
In Wednesday's session, the AUD/JPY pair displayed signs of correction, retreating to the 104.30 mark following an earlier surge to 104.90. Seemingly, buyers are finding it tough to maintain upward traction. The market appears to have started a short-term correction phase.
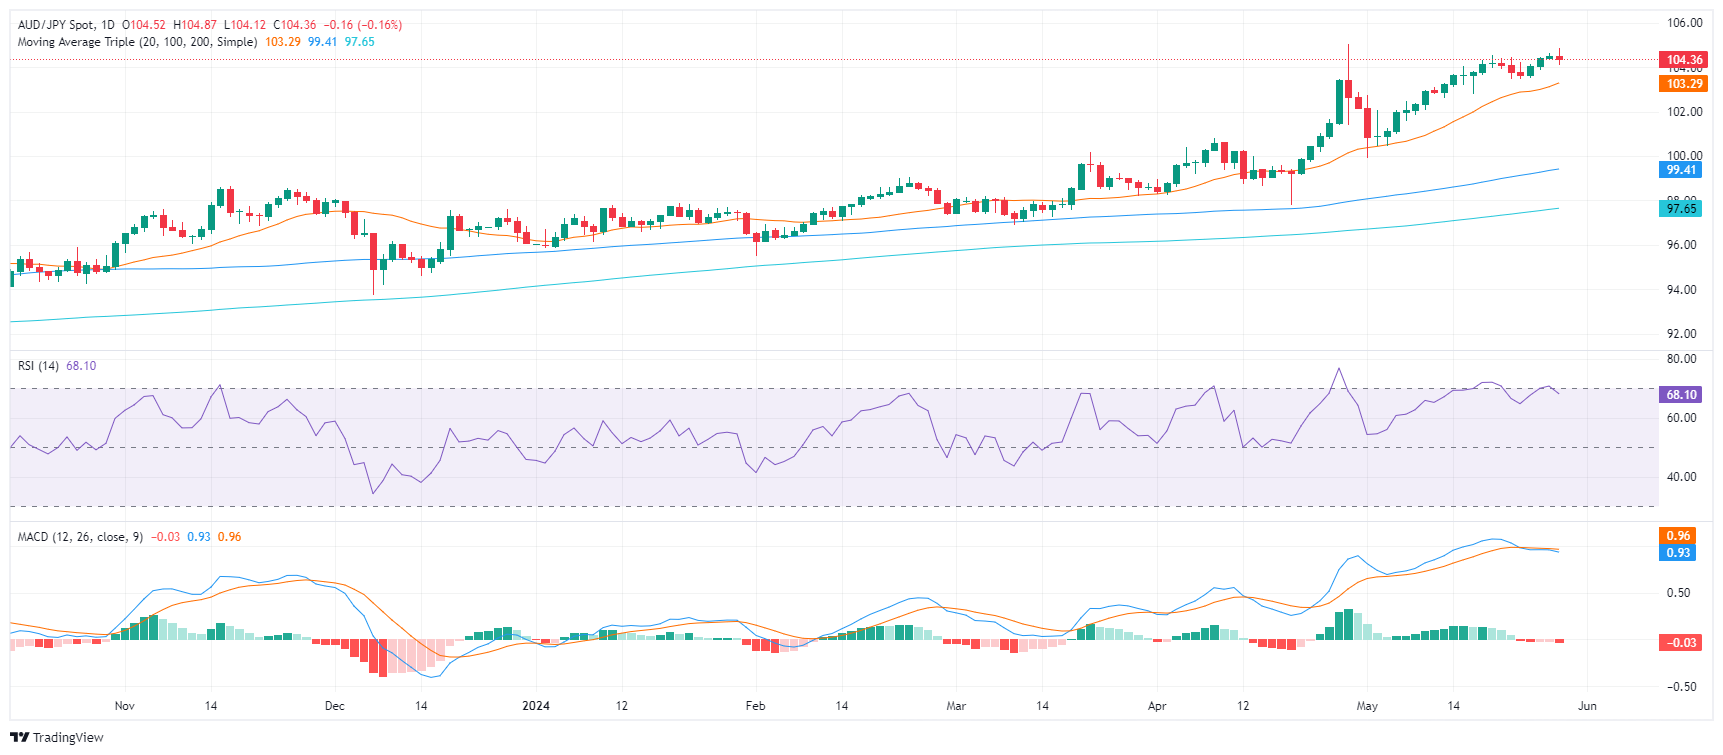
On the daily chart, the RSI has edged down to 67 territory, indicating easing of earlier overbought conditions. In sync with this, MACD continues to print red bars, further solidifying the possibility of weakening buying power.
AUD/JPY daily chart

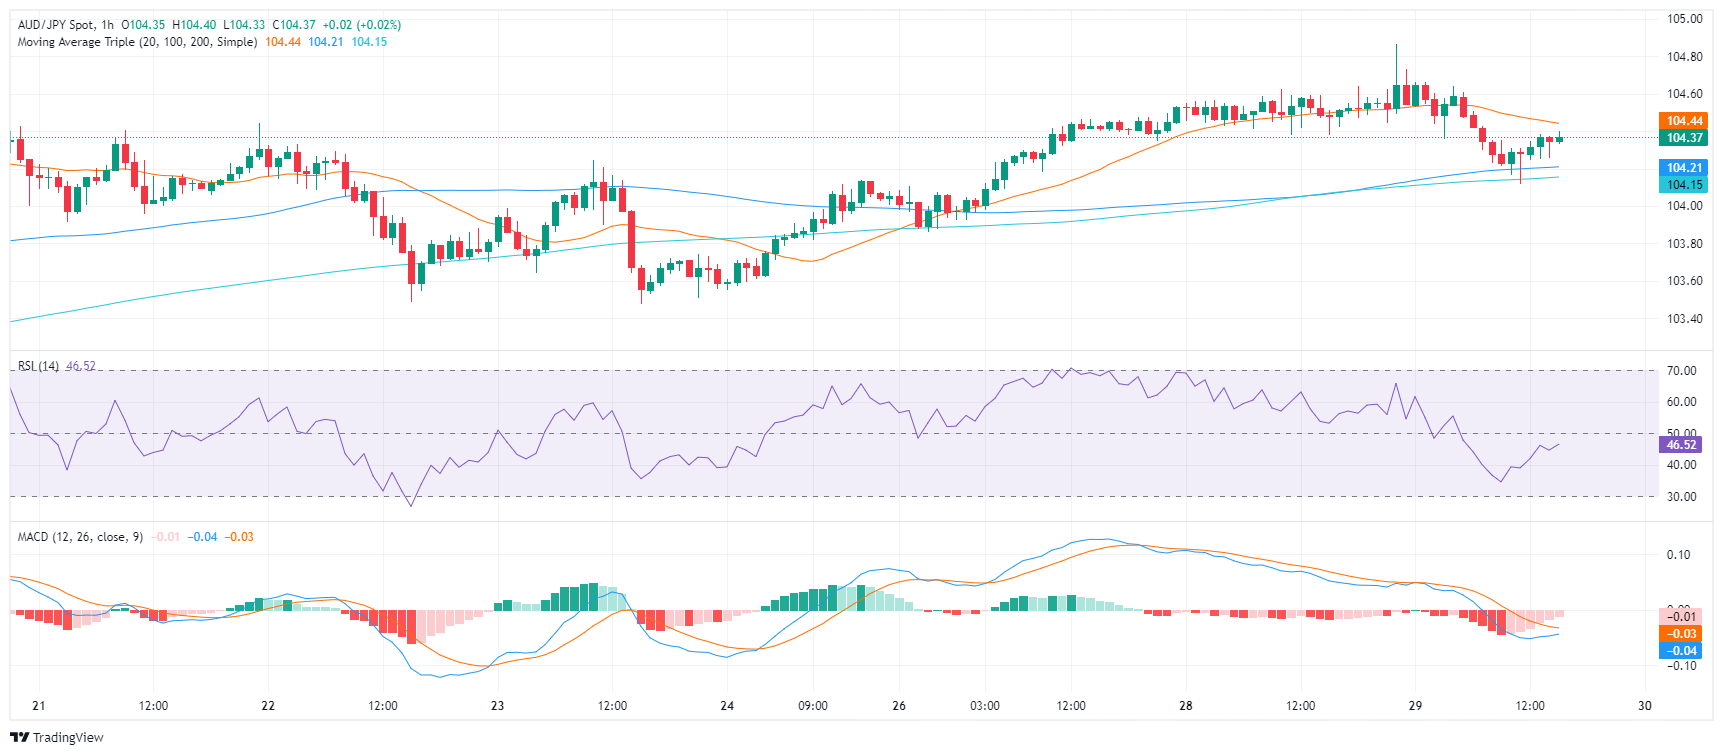
Reiterating these sentiments is the hourly chart. The RSI and MACD both remain in negative territory, indicating a probable near-term correction.
AUD/JPY hourly chart

The prominent resistance remains the cycle high just above 105.00 while the 20-day SMA, now at 103.29, continues to provide strong support.
